Hunterdon County Public Health Profile Report
Average Age at Death: Average age at death (years), 2021
Hunterdon 76.595% Confidence Interval (75.5 - 77.6)Description of the Confidence IntervalThe confidence interval indicates the range of probable true values for the level of risk in the community.
A value of "NA" (Not Available) will appear if the confidence interval was not published with the NJSHAD indicator data for this measure.State 74.2U.S. NA NA=Data not available.Hunterdon Compared to State
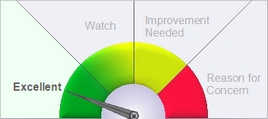
Description of GaugeDescription of the Gauge
This graphic is based on the county data to the left. It compares the county value of this indicator to the state overall value.- Excellent = The county's value on this indicator is BETTER than the state value, and the difference IS statistically significant.
- Watch = The county's value is BETTER than state value, but the difference IS NOT statistically significant.
- Improvement Needed = The county's value on this indicator is WORSE than the state value, but the difference IS NOT statistically significant.
- Reason for Concern = The county's value on this indicator is WORSE than the state value, and the difference IS statistically significant.
The county value is considered statistically significantly different from the state value if the state value is outside the range of the county's 95% confidence interval. If the county's data or 95% confidence interval information is not available, a blank gauge image will be displayed with the message, "missing information."NOTE: The labels used on the gauge graphic are meant to describe the county's status in plain language. The placement of the gauge needle is based solely on the statistical difference between the county and state values. When selecting priority health issues to work on, a county should take into account additional factors such as how much improvement could be made, the U.S. value, the statistical stability of the county number, the severity of the health condition, and whether the difference is clinically significant.
Why Is This Important?
Average age at death can be used as an easier-to-calculate proxy for life expectancy.How Are We Doing?
Average age at death is highest among Whites, followed, in order, by Asians, Blacks, and Hispanics. (Note that this may be due, in part, to the underlying age composition of each racial/ethnic group.) The average age at death among females is 7 years higher than among males. Among all causes of death, Alzheimer's disease has the highest average age (87.7 years). Unintentional injury has the lowest average age (52.0) among the ten leading causes of death. Deaths due to non-chronic conditions generally have much lower average ages at death than deaths due to chronic conditions.Related Indicators
Health Status Outcomes:
Note
Average age at death does not take into account the average age of the corresponding population. This can bias results in demographic groups whose age composition varies greatly from that of the overall population.Data Sources
Death Certificate Database, Office of Vital Statistics and Registry, New Jersey Department of HealthMeasure Description for Average Age at Death
Definition: The arithmetic mean age, in years, at which a group of persons died
Numerator: The sum of ages at death among decedents in a given time period
Denominator: Total number of decedents in that time period
