Ocean County Public Health Profile Report
Deaths due to Cancer: Deaths per 100,000 Standardized Population, 2020
Ocean 152.995% Confidence Interval (143.1 - 162.7)Description of the Confidence IntervalThe confidence interval indicates the range of probable true values for the level of risk in the community.
A value of "NA" (Not Available) will appear if the confidence interval was not published with the NJSHAD indicator data for this measure.State 133.3U.S. 144.1Ocean Compared to State
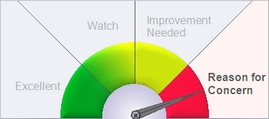
Description of GaugeDescription of the Gauge
This graphic is based on the county data to the left. It compares the county value of this indicator to the state overall value.- Excellent = The county's value on this indicator is BETTER than the state value, and the difference IS statistically significant.
- Watch = The county's value is BETTER than state value, but the difference IS NOT statistically significant.
- Improvement Needed = The county's value on this indicator is WORSE than the state value, but the difference IS NOT statistically significant.
- Reason for Concern = The county's value on this indicator is WORSE than the state value, and the difference IS statistically significant.
The county value is considered statistically significantly different from the state value if the state value is outside the range of the county's 95% confidence interval. If the county's data or 95% confidence interval information is not available, a blank gauge image will be displayed with the message, "missing information."NOTE: The labels used on the gauge graphic are meant to describe the county's status in plain language. The placement of the gauge needle is based solely on the statistical difference between the county and state values. When selecting priority health issues to work on, a county should take into account additional factors such as how much improvement could be made, the U.S. value, the statistical stability of the county number, the severity of the health condition, and whether the difference is clinically significant.
Why Is This Important?
For decades, cancer was the second leading cause of death in the U.S. and New Jersey. In 2020, it was New Jersey's third leading cause of death after heart disease and COVID-19.How Are We Doing?
The age-adjusted death rate due to cancer has been slowly declining for many years. In New Jersey, more than 15,000 deaths each year are due to cancer. In the total population and among each racial/ethnic group, males have higher death rates than females. The age-adjusted death rate due to cancer is highest among Blacks and Whites in New Jersey. County rates per 100,000 population (age-adjusted) range from a low of 112 in Hudson to a high of 180 in Cumberland. The revised Healthy New Jersey 2020 targets were achieved by all racial/ethnic groups except Asians.What Is Being Done?
The [https://www.nj.gov/health/ces/public/resources/occp.shtml Office of Cancer Control and Prevention] (OCCP) coordinates comprehensive cancer control efforts in New Jersey and participates in the national efforts of the CDC to establish state-based comprehensive cancer control plans, conduct prevention of cancer risk factors, enhance early detection of preventable cancers, and facilitate survivorship through the activities of its Regional Chronic Disease Coalitions. The [https://nj.gov/health/ces/public/resources/njceed.shtml New Jersey Cancer Education and Early Detection] (NJCEED) Program provides comprehensive outreach, education and screening services for breast, cervical, colorectal and prostate cancers to eligible residents.Evidence-based Practices
The risk of getting many common kinds of cancer can be lowered by making healthy choices like keeping a healthy weight, avoiding tobacco, and limiting alcohol consumption. Getting screening tests regularly may find breast, cervical, and colorectal cancers early, when treatment is likely to work best. Vaccines can help prevent several kinds of cancer. For example, the human papillomavirus (HPV) vaccine helps prevent most cervical cancers and several other kinds of cancer and the hepatitis B vaccine can help lower liver cancer risk.[https://www.cdc.gov/cancer/dcpc/prevention/ ^1^]Healthy People Objective C-1:
Reduce the overall cancer death rateU.S. Target: 161.4 deaths per 100,000 population (age-adjusted)
State Target: 135.5 deaths per 100,000 population (age-adjusted)
Related Indicators
Risk Factors:
Health Status Outcomes:
Data Sources
Death Certificate Database, Office of Vital Statistics and Registry, New Jersey Department of Health Population Estimates, [https://www.nj.gov/labor/lpa/dmograph/est/est_index.html State Data Center], New Jersey Department of Labor and Workforce DevelopmentMeasure Description for Deaths due to Cancer
Definition: Deaths with malignant neoplasm (cancer) as the underlying cause of death.
ICD-10 codes: C00-C97
Numerator: Number of deaths due to all types of cancer
Denominator: Total number of persons in the population
