Somerset County Public Health Profile Report
Incidence of All Invasive Cancers: Rate per 100,000 Standardized Population, 2020*
Somerset 425.695% Confidence Interval (405.8 - 446.2)Description of the Confidence IntervalThe confidence interval indicates the range of probable true values for the level of risk in the community.
A value of "NA" (Not Available) will appear if the confidence interval was not published with the NJSHAD indicator data for this measure.State 442.1U.S. 438.0Somerset Compared to State
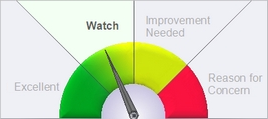
Description of GaugeDescription of the Gauge
This graphic is based on the county data to the left. It compares the county value of this indicator to the state overall value.- Excellent = The county's value on this indicator is BETTER than the state value, and the difference IS statistically significant.
- Watch = The county's value is BETTER than state value, but the difference IS NOT statistically significant.
- Improvement Needed = The county's value on this indicator is WORSE than the state value, but the difference IS NOT statistically significant.
- Reason for Concern = The county's value on this indicator is WORSE than the state value, and the difference IS statistically significant.
The county value is considered statistically significantly different from the state value if the state value is outside the range of the county's 95% confidence interval. If the county's data or 95% confidence interval information is not available, a blank gauge image will be displayed with the message, "missing information."NOTE: The labels used on the gauge graphic are meant to describe the county's status in plain language. The placement of the gauge needle is based solely on the statistical difference between the county and state values. When selecting priority health issues to work on, a county should take into account additional factors such as how much improvement could be made, the U.S. value, the statistical stability of the county number, the severity of the health condition, and whether the difference is clinically significant.
Why Is This Important?
Many cancers are preventable and screening is effective in identifying some types of cancers in early, often highly treatable stages.How Are We Doing?
New Jersey's overall cancer incidence rate continues to decline. The rate is highest among Whites followed by Blacks and Hispanics with significant differences between the rate for each racial/ethnic group. Rates by site are higher among males than females for lung and bronchus, colon and rectum, melanoma of the skin, and non-Hodgkin lymphoma. Rates by county range from a low of 350.6 in Hudson to a high of 529.8 in Cape May.What Is Being Done?
A [https://www.cdc.gov/cancer/ncccp/ccc_plans.htm Comprehensive Cancer Control Plan] was developed by the Task Force on Cancer Prevention, Early Detection and Treatment in New Jersey which aims to reduce the incidence, illness, and deaths due to cancer among New Jersey residents.Related Indicators
Health Care System Factors:
- Self-Reported Cervical Cancer Screening
- Self-Reported Colorectal Cancer Screening
- Self-Reported Breast Cancer Screening Among Women
- Self-Reported Prostate Cancer Screening
Risk Factors:
- Cigarette Use among Middle School Students
- Cigarette Use among High School Students
- Secondhand Smoke Exposure among High School Students
- Tobacco Use among High School Students
- Obesity Among Adults
- Cigarette Smoking Among Adults
- Alcohol Consumption - Binge Drinking
Health Status Outcomes:
- Incidence of Bladder Cancer
- Incidence of Breast Cancer in Females
- Incidence of Lung & Bronchus Cancer
- Incidence of Melanoma of the Skin
- Incidence of Non-Hodgkin Lymphoma
- Incidence of Thyroid Cancer
- Deaths due to Melanoma of the Skin
- Deaths due to Prostate Cancer
- Deaths due to Cancer
- Deaths due to Colorectal Cancer
- Cancer Five-Year Survival Rate
- Incidence of Colorectal Cancer
- Incidence of Late-Stage Breast Cancer
- Deaths due to Lung Cancer
- Deaths due to Breast Cancer
Note
Rates are per 100,000 and age-adjusted to the 2000 US Std Population (19 age groups - Census P25-1130) standard; Confidence intervals (Tiwari mod) are 95% for rates. Data Source: NJ State Cancer Registry SEER*Stat Database: February 17, 2023 analytic file. Created on 3/23/23. *NJ 2020 data is considered preliminary and should not be used in trend analyses; an approximate 10% decrease in the number of cancer cases diagnosed in 2020 compared to 2019, is partly due to the COVID-19 pandemic. US data are for 2019.Data Sources
New Jersey State Cancer Registry, Cancer Epidemiology Services, New Jersey Department of Health, [https://www.nj.gov/health/ces/reporting-entities/njscr/]Measure Description for Incidence of All Invasive Cancers
Definition: The age-adjusted rate of invasive cancer per 100,000 population.
ICD-O codes: C00-C97
Numerator: Number of persons with invasive cancer
Denominator: Total number of persons in the population
