Hudson County Public Health Profile Report
General Health Status: Estimated Percent, 2017-2020*
Hudson 82.795% Confidence Interval (79.5 - 85.4)Description of the Confidence IntervalThe confidence interval indicates the range of probable true values for the level of risk in the community.
A value of "NA" (Not Available) will appear if the confidence interval was not published with the NJSHAD indicator data for this measure.State 84.7U.S. NA NA=Data not available.Hudson Compared to State
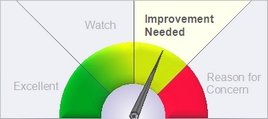
Description of GaugeDescription of the Gauge
This graphic is based on the county data to the left. It compares the county value of this indicator to the state overall value.- Excellent = The county's value on this indicator is BETTER than the state value, and the difference IS statistically significant.
- Watch = The county's value is BETTER than state value, but the difference IS NOT statistically significant.
- Improvement Needed = The county's value on this indicator is WORSE than the state value, but the difference IS NOT statistically significant.
- Reason for Concern = The county's value on this indicator is WORSE than the state value, and the difference IS statistically significant.
The county value is considered statistically significantly different from the state value if the state value is outside the range of the county's 95% confidence interval. If the county's data or 95% confidence interval information is not available, a blank gauge image will be displayed with the message, "missing information."NOTE: The labels used on the gauge graphic are meant to describe the county's status in plain language. The placement of the gauge needle is based solely on the statistical difference between the county and state values. When selecting priority health issues to work on, a county should take into account additional factors such as how much improvement could be made, the U.S. value, the statistical stability of the county number, the severity of the health condition, and whether the difference is clinically significant.
Why Is This Important?
Self-rated health (SRH) is an independent predictor of important health outcomes including mortality, morbidity, and functional status. It is considered to be a reliable indicator of a person's perceived health and is a good global assessment of a person's well being.How Are We Doing?
In 2020, 88.4% of New Jersey adults aged 18 and older reported good, very good or excellent general health status.Note
Question Text: "Would you say that in general your health is excellent, very good, good, fair, or poor?" *2019 data is not included in the average estimated prevalence. No data is available for 2019.Data Sources
Behavioral Risk Factor Survey, Center for Health Statistics, New Jersey Department of Health, [http://www.state.nj.us/health/chs/njbrfs/]Measure Description for General Health Status
Definition: Percentage of adults in designated subgroup who reported good, very good, or excellent general health
Numerator: Weighted number of survey respondents in designated subgroup who reported good, very good, or excellent general health
Denominator: Weighted total number of survey respondents in designated subgroup except those with missing, "Don't know/Not sure," and "Refused" responses
