Cape May County Public Health Profile Report
Deaths due to Heart Disease: Deaths per 100,000 Standardized Population, 2020
Cape May 207.395% Confidence Interval (177.9 - 236.8)Description of the Confidence IntervalThe confidence interval indicates the range of probable true values for the level of risk in the community.
A value of "NA" (Not Available) will appear if the confidence interval was not published with the NJSHAD indicator data for this measure.State 166.1U.S. 168.2Cape May Compared to State
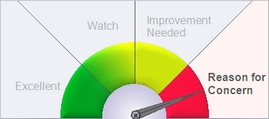
Description of GaugeDescription of the Gauge
This graphic is based on the county data to the left. It compares the county value of this indicator to the state overall value.- Excellent = The county's value on this indicator is BETTER than the state value, and the difference IS statistically significant.
- Watch = The county's value is BETTER than state value, but the difference IS NOT statistically significant.
- Improvement Needed = The county's value on this indicator is WORSE than the state value, but the difference IS NOT statistically significant.
- Reason for Concern = The county's value on this indicator is WORSE than the state value, and the difference IS statistically significant.
The county value is considered statistically significantly different from the state value if the state value is outside the range of the county's 95% confidence interval. If the county's data or 95% confidence interval information is not available, a blank gauge image will be displayed with the message, "missing information."NOTE: The labels used on the gauge graphic are meant to describe the county's status in plain language. The placement of the gauge needle is based solely on the statistical difference between the county and state values. When selecting priority health issues to work on, a county should take into account additional factors such as how much improvement could be made, the U.S. value, the statistical stability of the county number, the severity of the health condition, and whether the difference is clinically significant.
Why Is This Important?
Heart disease affects every segment of the population. It is the leading cause of death among all Americans, all New Jerseyans, and for both men and women.How Are We Doing?
The age-adjusted death rate due to heart disease had been steadily declining for many years before increasing in 2020. In recent years, nearly 19,000 NJ resident deaths each year were due to heart disease. In 2020, there were over 19,700 such deaths. In the total population and among each racial/ethnic group, males have a higher death rate than females. Among the four major racial/ethnic groups in New Jersey, the rate is highest among Blacks. In 2020, county rates ranged from a low of 124 deaths per 100,000 residents (age-adjusted) in Somerset to a high of 253 in Cumberland.Related Indicators
Health Care System Factors:
Risk Factors:
- Cardiovascular Disease - High Blood Pressure
- Cardiovascular Disease - High Cholesterol
- Physical Activity-Adult Prevalence
- Obesity Among Adults
- Cigarette Smoking Among Adults
- Diabetes (Diagnosed) Prevalence
Health Status Outcomes:
Data Sources
Death Certificate Database, Office of Vital Statistics and Registry, New Jersey Department of Health Population Estimates, [https://www.nj.gov/labor/lpa/dmograph/est/est_index.html State Data Center], New Jersey Department of Labor and Workforce DevelopmentMeasure Description for Deaths due to Heart Disease
Definition: Deaths with heart disease as the underlying cause of death.
ICD-10 codes: I00-I09,I11,I13,I20-I51
Numerator: Number of deaths due to heart disease
Denominator: Total number of persons in the population
