Union County Public Health Profile Report
Hospitalization and Emergency Department Visits for Heat Related Illnesses: Annual Age-Adjusted Hospitalization Rates per 100,000, May through September, 2017-2021
Union 0.7895% Confidence Interval NADescription of the Confidence IntervalThe confidence interval indicates the range of probable true values for the level of risk in the community.
A value of "NA" (Not Available) will appear if the confidence interval was not published with the NJSHAD indicator data for this measure.State 1.60U.S. NA NA=Data not available.Union Compared to State
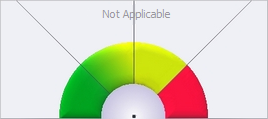
Description of GaugeDescription of the Gauge
This graphic is based on the county data to the left. It compares the county value of this indicator to the state overall value.- Excellent = The county's value on this indicator is BETTER than the state value, and the difference IS statistically significant.
- Watch = The county's value is BETTER than state value, but the difference IS NOT statistically significant.
- Improvement Needed = The county's value on this indicator is WORSE than the state value, but the difference IS NOT statistically significant.
- Reason for Concern = The county's value on this indicator is WORSE than the state value, and the difference IS statistically significant.
The county value is considered statistically significantly different from the state value if the state value is outside the range of the county's 95% confidence interval. If the county's data or 95% confidence interval information is not available, a blank gauge image will be displayed with the message, "missing information."NOTE: The labels used on the gauge graphic are meant to describe the county's status in plain language. The placement of the gauge needle is based solely on the statistical difference between the county and state values. When selecting priority health issues to work on, a county should take into account additional factors such as how much improvement could be made, the U.S. value, the statistical stability of the county number, the severity of the health condition, and whether the difference is clinically significant.
Why Is This Important?
The relationship between extreme heat and increased daily morbidity is well established. This indicator captures inpatient hospital admissions or emergency department visits for heat-related illness or hyperthermia.How Are We Doing?
Average annual temperatures in New Jersey have increased about 1.2 degrees Fahrenheit (F) between the period of 1971-2000 and the period of 2001-2010. In New Jersey, the total number of days over 90 degrees F has increased by roughly 36 percent since 1949. On average, based on data from 16 weather station locations spread across New Jersey, the number of days over 90 degrees F have increased from about 17 to 23 per year. There are however considerable temperature differences between north and south, coastal and inland, and urban and rural sections of New Jersey. Extreme heat events are predicted to increase in both intensity and duration in future years. Currently, New Jersey generally experiences two heat waves per year with temperatures exceeding 90 F, and the heat waves last about four days. By the 2020s, it is projected that New Jersey will annually experience three to four heat waves lasting four to five days each. Annual number of days over 90 degrees F are projected to rise from an average of 14 days in 2000 to 23-29 days by the 2020s.What Is Being Done?
The NJDOH is using data collected from emergency departments and hospitals to identify and track excessive heat related illnesses among New Jersey's residents. NJDOH will use the information to implement targeted excessive heat event notification and actions that focus surveillance and relief efforts on high risk populations or communities. Appropriate actions include: establishing enhanced real-time syndromic surveillance systems to alert public health officials about increases in heat-related illnesses; enhancing real-time public notification regarding extreme heat events through the web, broadcast media, and social media; and enhancing access to cooling centers.Note
** Rates and counts are suppressed if fewer than 10 cases were reported in a specific category.Data Sources
Office of Health Care Quality and Assessment, New Jersey Department of Health, [http://www.nj.gov/health/healthcarequality/]Measure Description for Hospitalization and Emergency Department Visits for Heat Related Illnesses
Definition: Count or rate of hospitalization and emergency department visits for heat-related illnesses for a defined population in a specified time interval. Cases were selected using the following ICD-9 codes through September 2015: 992.0 - 992.9, E900.0, or E900.9 as a primary diagnosis, injury cause, or other diagnosis for occurrences during the months of May through September. Cases were excluded if a man-made source of heat (ICD-9 E900.1) was listed. Beginning October 2015, heat-related illness was defined by ICD-10 codes T67, X30, and X32 (exclusion W92).
Numerator: Count of inpatient hospitalizations or emergency department visits for heat related illnesses among a defined population during the months of May through September.
Denominator: Defined population in a specified time interval.
