Somerset County Public Health Profile Report
Immunizations - Pneumococcal Vaccination: Estimated Percent, 2017-2020*
Somerset 68.395% Confidence Interval (60.6 - 75.1)Description of the Confidence IntervalThe confidence interval indicates the range of probable true values for the level of risk in the community.
A value of "NA" (Not Available) will appear if the confidence interval was not published with the NJSHAD indicator data for this measure.State 67.8U.S. NA NA=Data not available.Somerset Compared to State
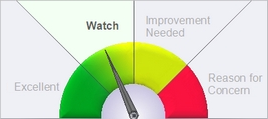
Description of GaugeDescription of the Gauge
This graphic is based on the county data to the left. It compares the county value of this indicator to the state overall value.- Excellent = The county's value on this indicator is BETTER than the state value, and the difference IS statistically significant.
- Watch = The county's value is BETTER than state value, but the difference IS NOT statistically significant.
- Improvement Needed = The county's value on this indicator is WORSE than the state value, but the difference IS NOT statistically significant.
- Reason for Concern = The county's value on this indicator is WORSE than the state value, and the difference IS statistically significant.
The county value is considered statistically significantly different from the state value if the state value is outside the range of the county's 95% confidence interval. If the county's data or 95% confidence interval information is not available, a blank gauge image will be displayed with the message, "missing information."NOTE: The labels used on the gauge graphic are meant to describe the county's status in plain language. The placement of the gauge needle is based solely on the statistical difference between the county and state values. When selecting priority health issues to work on, a county should take into account additional factors such as how much improvement could be made, the U.S. value, the statistical stability of the county number, the severity of the health condition, and whether the difference is clinically significant.
Why Is This Important?
Recommended immunizations for adults aged 65 years and older include a yearly immunization against influenza (flu) and a one-time immunization against pneumococcal disease. Most of the deaths and serious illnesses caused by influenza and pneumococcal disease occur in older adults and others at increased risk for complications of these diseases because of other risk factors or medical conditions. Barriers to adult immunization include not knowing immunizations are needed, misconceptions about vaccines, and lack of recommendations from health care providers.How Are We Doing?
In 2020, 62.5% of all New Jersey adults aged 65 and older reported having received the Pneumococcal vaccination in the past 12 months. Pneumococcal vaccination is lower among Hispanics (41.1%) compared to Whites (69.1%) and Blacks (51.7%).What Is Being Done?
Since 1998, NJDOH has adopted regulations requiring nursing homes to offer pneumococcal and influenza immunizations to all residents, and for hospitals to offer them to seniors who have been admitted for treatment. Education and outreach methods have also been made throughout the state.Healthy People Objective IID-13.1:
Increase the percentage of adults who are vaccinated against pneumococcal disease: Noninstitutionalized adults aged 65 years and olderU.S. Target: 90 percent
State Target: 72.2 percent
Note
*2019 data is not included in the average estimated prevalence. No data is available for 2019.Data Sources
Behavioral Risk Factor Survey, Center for Health Statistics, New Jersey Department of Health, [http://www.state.nj.us/health/chs/njbrfs/]Measure Description for Immunizations - Pneumococcal Vaccination
Definition: Percentage of adults age 65+ who reported ever receiving a pneumococcal vaccination in their lifetime.
Numerator: Number of survey respondents age 65+ who reported ever receiving a pneumococcal vaccine anytime during their life
Denominator: Number of survey respondents age 65+
