Hudson County Public Health Profile Report
Incidence of Childhood Leukemia: Age-Adjusted rate per 100,000, 1990-2018
Hudson 5.395% Confidence Interval (4.6 - 6.2)Description of the Confidence IntervalThe confidence interval indicates the range of probable true values for the level of risk in the community.
A value of "NA" (Not Available) will appear if the confidence interval was not published with the NJSHAD indicator data for this measure.State 5.3U.S. NA NA=Data not available.Hudson Compared to State
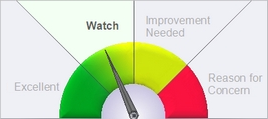
Description of GaugeDescription of the Gauge
This graphic is based on the county data to the left. It compares the county value of this indicator to the state overall value.- Excellent = The county's value on this indicator is BETTER than the state value, and the difference IS statistically significant.
- Watch = The county's value is BETTER than state value, but the difference IS NOT statistically significant.
- Improvement Needed = The county's value on this indicator is WORSE than the state value, but the difference IS NOT statistically significant.
- Reason for Concern = The county's value on this indicator is WORSE than the state value, and the difference IS statistically significant.
The county value is considered statistically significantly different from the state value if the state value is outside the range of the county's 95% confidence interval. If the county's data or 95% confidence interval information is not available, a blank gauge image will be displayed with the message, "missing information."NOTE: The labels used on the gauge graphic are meant to describe the county's status in plain language. The placement of the gauge needle is based solely on the statistical difference between the county and state values. When selecting priority health issues to work on, a county should take into account additional factors such as how much improvement could be made, the U.S. value, the statistical stability of the county number, the severity of the health condition, and whether the difference is clinically significant.
Why Is This Important?
In general, childhood cancers are rare and represent about 1% of all cancers. Leukemias are the most common childhood cancers, accounting for about 30 percent of all cancers in children age 0 - 14 years. Acute lymphocytic leukemia (ALL) accounts for about 75 percent of childhood leukemias. At this time, we do not know what causes most leukemias.How Are We Doing?
Between 1990 and 2018, New Jersey childhood leukemia incidence rates (ages 0 - 14, and 0 - 19), were generally stable. On average, 107 children ages 0-19 are diagnosed annually with leukemia in New Jersey. Mortality rates for most types of childhood cancers have steadily decreased in recent years due to improved treatments.What Is Being Done?
A Comprehensive Cancer Control Plan was developed by the Task Force on Cancer Prevention, Early Detection and Treatment in New Jersey which aims to reduce the incidence, illness and death due to cancer among New Jersey residents. [https://www.cdc.gov/cancer/ncccp/ccc_plans.htm]Note
Incidence rates (cases per 100,000 population per year) are age-adjusted to the 2000 US standard population (19 age groups: <1, 1-4, 5-9, ..., 80-84, 85+). Rates are for invasive cancer only (except for bladder cancer which is invasive and in situ) or unless otherwise specified. Number of cases (numerator) is the total count of cases over the defined interval.Data Sources
NJ State Cancer Registry, Nov 16, 2020 Analytic File, using NCI SEER*Stat ver. 8.3.9, [https://seer.cancer.gov/seerstat/] NJ population estimates as calculated by the NCI's SEER Program, released February 2021, [https://www.seer.cancer.gov/popdata/download.html]Measure Description for Incidence of Childhood Leukemia
Definition: Incidence rate of leukemia in children for a defined population in a specified time interval. Rates are age-adjusted to the 2000 U.S. Standard Population. Rates are per 100,000 population.
Numerator: Number of new cases of leukemia in children among a defined population in a specified time interval. Cases were selected using ICCC recode ICD-0-3/WHO recode.
Denominator: Defined population in a specified time interval. Population age groups 0-14 and 0-19 are both found to be useful by the International Classification of Childhood Cancers (ICCC).
