Morris County Public Health Profile Report
Deaths due to Motor Vehicle-Related Injuries: Deaths per 100,000 Population, 2018-2020
Morris 4.195% Confidence Interval (3.1 - 5.2)Description of the Confidence IntervalThe confidence interval indicates the range of probable true values for the level of risk in the community.
A value of "NA" (Not Available) will appear if the confidence interval was not published with the NJSHAD indicator data for this measure.State 6.5U.S. 11.9Morris Compared to State
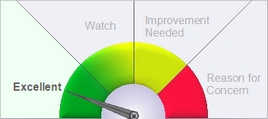
Description of GaugeDescription of the Gauge
This graphic is based on the county data to the left. It compares the county value of this indicator to the state overall value.- Excellent = The county's value on this indicator is BETTER than the state value, and the difference IS statistically significant.
- Watch = The county's value is BETTER than state value, but the difference IS NOT statistically significant.
- Improvement Needed = The county's value on this indicator is WORSE than the state value, but the difference IS NOT statistically significant.
- Reason for Concern = The county's value on this indicator is WORSE than the state value, and the difference IS statistically significant.
The county value is considered statistically significantly different from the state value if the state value is outside the range of the county's 95% confidence interval. If the county's data or 95% confidence interval information is not available, a blank gauge image will be displayed with the message, "missing information."NOTE: The labels used on the gauge graphic are meant to describe the county's status in plain language. The placement of the gauge needle is based solely on the statistical difference between the county and state values. When selecting priority health issues to work on, a county should take into account additional factors such as how much improvement could be made, the U.S. value, the statistical stability of the county number, the severity of the health condition, and whether the difference is clinically significant.
Why Is This Important?
Motor vehicle crashes are the 2nd leading cause of unintentional injury death in the United States and in New Jersey.How Are We Doing?
The number of motor vehicle crashes occurring in New Jersey experienced a large decline in 2020, from over 270,000 each year between 2016 and 2019 to fewer than 191,000 in 2020. Meanwhile, the injury rate remained stable at about 22% of crashes.[https://www.state.nj.us/transportation/refdata/accident/crash_statistics.shtm ^1^] However, fatalities rose in 2020. Death rates due to motor vehicle-related injuries are on a slow downward trend in New Jersey and the United States dating back to the early 1990's, however there were increases in both the US and New Jersey rates between 2019 and 2020. In New Jersey, most of the increase was among Blacks. While there is usually no statistically significant difference in age-adjusted death rates among Blacks, Whites, and Hispanics in New Jersey, in 2020 the rate among Blacks was significantly higher than among other racial/ethnic groups. It is conceivable that the COVID-19 pandemic caused an increase in other causes of death due to delays in medical care and fears of going to the hospital and being exposed to COVID. The age-adjusted motor vehicle-related death rate among males is nearly triple that of females and about 70% of motor vehicle-related fatalities are among males. County rates vary from 3.7 per 100,000 population (age-adjusted) in Hudson to 16.9 in Cumberland (2018-2020 data).What Is Being Done?
The National Highway Traffic Safety Administration's "[http://www.nhtsa.gov/CIOT Click It or Ticket]" campaign is the most successful seat belt enforcement campaign ever, helping achieve an all-time high national seat belt usage rate of 90 percent.[https://www.nhtsa.gov/risky-driving/seat-belts ^2^] New Jersey's laws to protect drivers, passengers, bicyclists, and pedestrians are among the most stringent in the nation and can be viewed at [https://www.ghsa.org/state-laws].Healthy People Objective IVP-13.1:
Reduce motor vehicle crash-related deaths: Deaths per 100,000 populationU.S. Target: 12.4 deaths per 100,000 population (age-adjusted)
State Target: 7.1 deaths per 100,000 population (age-adjusted)
Related Indicators
Risk Factors:
Health Status Outcomes:
Note
County is the decedent's county of residence, not the county where the injury occurred.Data Sources
Centers for Disease Control and Prevention, National Center for Health Statistics. Underlying Cause of Death File. CDC WONDER On-line Database accessed at [https://wonder.cdc.gov/Deaths-by-Underlying-Cause.html] Death Certificate Database, Office of Vital Statistics and Registry, New Jersey Department of Health Population Estimates, [https://www.nj.gov/labor/lpa/dmograph/est/est_index.html State Data Center], New Jersey Department of Labor and Workforce DevelopmentMeasure Description for Deaths due to Motor Vehicle-Related Injuries
Definition: Deaths with motor vehicle-related injury as the underlying cause of death. Motor vehicle-related deaths include motor vehicle and motorcycle drivers and passengers, pedestrians, and bicyclists struck by motor vehicles both on roadways in traffic and in other areas such as parking lots and driveways.
ICD-10 codes: V02-V04, V09.0, V09.2, V12-V14, V19.0-V19.2, V19.4-V19.6, V20-V79, V80.3-V80.5, V81.0-V81.1, V82.0-V82.1, V83-V86, V87.0-V87.8, V88.0-V88.8, V89.0, V89.2
Numerator: Number of deaths due to motor vehicle-related injuries
Denominator: Total number of persons in the population
