Salem County Public Health Profile Report
Deaths due to Influenza and Pneumonia: Deaths per 100,000 Standardized Population, 2018-2020
Salem 25.095% Confidence Interval (17.9 - 32.2)Description of the Confidence IntervalThe confidence interval indicates the range of probable true values for the level of risk in the community.
A value of "NA" (Not Available) will appear if the confidence interval was not published with the NJSHAD indicator data for this measure.State 12.5U.S. 13.4Salem Compared to State
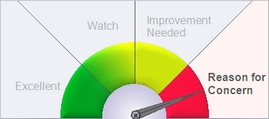
Description of GaugeDescription of the Gauge
This graphic is based on the county data to the left. It compares the county value of this indicator to the state overall value.- Excellent = The county's value on this indicator is BETTER than the state value, and the difference IS statistically significant.
- Watch = The county's value is BETTER than state value, but the difference IS NOT statistically significant.
- Improvement Needed = The county's value on this indicator is WORSE than the state value, but the difference IS NOT statistically significant.
- Reason for Concern = The county's value on this indicator is WORSE than the state value, and the difference IS statistically significant.
The county value is considered statistically significantly different from the state value if the state value is outside the range of the county's 95% confidence interval. If the county's data or 95% confidence interval information is not available, a blank gauge image will be displayed with the message, "missing information."NOTE: The labels used on the gauge graphic are meant to describe the county's status in plain language. The placement of the gauge needle is based solely on the statistical difference between the county and state values. When selecting priority health issues to work on, a county should take into account additional factors such as how much improvement could be made, the U.S. value, the statistical stability of the county number, the severity of the health condition, and whether the difference is clinically significant.
Why Is This Important?
Influenza and pneumonia combined were the eleventh leading cause of death among New Jersey residents and ninth among all US residents in 2020. (Influenza and pneumonia are combined for ranking as a leading cause of death, however the majority of those deaths are due to pneumonia.)How Are We Doing?
The age-adjusted death rate due to influenza and pneumonia had been generally declining for many years, however the rate increased in 2020. In the total population and among each racial/ethnic group, males have a significantly higher death rate than females. For 2018-2020, county rates per 100,000 population (age-adjusted) ranged from a low of 9.5 in Burlington to a high of 25.0 in Salem.What Is Being Done?
The New Jersey Department of Health has several programs that track influenza and pneumonia infections or that [https://njiis.nj.gov/core/web/index.html#/mission track] and/or promote vaccination. Health care professionals are to immediately call in confirmed or suspected cases of influenza to the local health department. The [https://njiis.nj.gov/core/web/index.html#/vfcDocs Vaccines for Children Program] provides pediatric vaccines at no cost to doctors who serve children who might not otherwise be vaccinated because of inability to pay.Evidence-based Practices
Annual influenza vaccination is the most effective method for preventing influenza virus infection and its complications.[https://www.cdc.gov/flu/prevent/index.html ^1^] Vaccination against pneumococcal disease has been effective in reducing infections among seniors and persons with certain medical conditions.[https://www.cdc.gov/pneumonia/prevention.html ^2^]Related Indicators
Health Care System Factors:
Note
Influenza and pneumonia are combined for ranking as a leading cause of death, however the majority (86.0 to 99.9%, depending on the year) of those deaths are due to pneumonia. Not all pneumonia deaths are related to influenza. Pneumonia can also be due to other viruses as well as bacteria. See [https://icd.who.int/browse10/2019/en#/J09-J18] for a complete list.Data Sources
Death Certificate Database, Office of Vital Statistics and Registry, New Jersey Department of Health Population Estimates, [https://www.nj.gov/labor/lpa/dmograph/est/est_index.html State Data Center], New Jersey Department of Labor and Workforce DevelopmentMeasure Description for Deaths due to Influenza and Pneumonia
Definition: Deaths with influenza or pneumonia as the underlying cause of death.
ICD-10 codes: J09-J18
Numerator: Number of deaths due to influenza and pneumonia
Denominator: Total number of persons in the population
