Union County Public Health Profile Report
Deaths due to Stroke: Deaths per 100,000 Standardized Population, 2020
Union 35.995% Confidence Interval (30.9 - 40.8)Description of the Confidence IntervalThe confidence interval indicates the range of probable true values for the level of risk in the community.
A value of "NA" (Not Available) will appear if the confidence interval was not published with the NJSHAD indicator data for this measure.State 31.8U.S. 38.8Union Compared to State
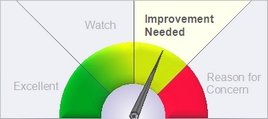
Description of GaugeDescription of the Gauge
This graphic is based on the county data to the left. It compares the county value of this indicator to the state overall value.- Excellent = The county's value on this indicator is BETTER than the state value, and the difference IS statistically significant.
- Watch = The county's value is BETTER than state value, but the difference IS NOT statistically significant.
- Improvement Needed = The county's value on this indicator is WORSE than the state value, but the difference IS NOT statistically significant.
- Reason for Concern = The county's value on this indicator is WORSE than the state value, and the difference IS statistically significant.
The county value is considered statistically significantly different from the state value if the state value is outside the range of the county's 95% confidence interval. If the county's data or 95% confidence interval information is not available, a blank gauge image will be displayed with the message, "missing information."NOTE: The labels used on the gauge graphic are meant to describe the county's status in plain language. The placement of the gauge needle is based solely on the statistical difference between the county and state values. When selecting priority health issues to work on, a county should take into account additional factors such as how much improvement could be made, the U.S. value, the statistical stability of the county number, the severity of the health condition, and whether the difference is clinically significant.
Why Is This Important?
Stroke was the fifth leading cause of death in New Jersey and the US in 2020. It is a major cause of serious disability for adults and it is preventable and treatable.How Are We Doing?
In New Jersey, more than 3,500 deaths each year are due to stroke. The age-adjusted death rate due to stroke was steadily declining before slight increases in 2019 and 2020. Blacks have the highest age-adjusted death rate due to stroke and experienced a large (25%) increase between 2019 and 2020 while the rate among Asians rose 6%, among Whites 2%, and decreased among Hispanics. It is conceivable that the COVID-19 pandemic caused an increase in deaths due to delays in medical care and fears of going to the hospital and being exposed to COVID. In the total population and among each racial/ethnic group, males have a higher death rate than females. County rates range from a low of 22.2 deaths per 100,000 residents (age-adjusted) in Hunterdon to a high of 48.5 in Salem. The Healthy New Jersey 2020 (HNJ2020) target was achieved by Blacks in 2018-2019 but the rate rose above the target in 2020. No other racial/ethnic group achieved its HNJ2020 target during the decade.Evidence-based Practices
[https://www.cdc.gov/stroke/prevention.htm Prevent Stroke: What You Can Do]Healthy People Objective HDS-3:
Reduce stroke deathsU.S. Target: 34.8 deaths per 100,000 population (age-adjusted)
State Target: 28.6 deaths per 100,000 population (age-adjusted)
Related Indicators
Risk Factors:
Data Sources
Death Certificate Database, Office of Vital Statistics and Registry, New Jersey Department of Health Population Estimates, [https://www.nj.gov/labor/lpa/dmograph/est/est_index.html State Data Center], New Jersey Department of Labor and Workforce DevelopmentMeasure Description for Deaths due to Stroke
Definition: Deaths with cerebrovascular disease (stroke) as the underlying cause of death.
ICD-10 codes: I60-I69
Numerator: Number of deaths due to stroke
Denominator: Total number of persons in the population
