Bergen County Public Health Profile Report
Homicide: Deaths per 100,000 Population, 2016-2020
Bergen 1.095% Confidence Interval (0.7 - 1.3)Description of the Confidence IntervalThe confidence interval indicates the range of probable true values for the level of risk in the community.
A value of "NA" (Not Available) will appear if the confidence interval was not published with the NJSHAD indicator data for this measure.State 4.1U.S. 6.4Bergen Compared to State
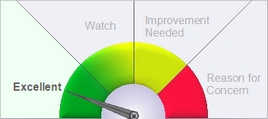
Description of GaugeDescription of the Gauge
This graphic is based on the county data to the left. It compares the county value of this indicator to the state overall value.- Excellent = The county's value on this indicator is BETTER than the state value, and the difference IS statistically significant.
- Watch = The county's value is BETTER than state value, but the difference IS NOT statistically significant.
- Improvement Needed = The county's value on this indicator is WORSE than the state value, but the difference IS NOT statistically significant.
- Reason for Concern = The county's value on this indicator is WORSE than the state value, and the difference IS statistically significant.
The county value is considered statistically significantly different from the state value if the state value is outside the range of the county's 95% confidence interval. If the county's data or 95% confidence interval information is not available, a blank gauge image will be displayed with the message, "missing information."NOTE: The labels used on the gauge graphic are meant to describe the county's status in plain language. The placement of the gauge needle is based solely on the statistical difference between the county and state values. When selecting priority health issues to work on, a county should take into account additional factors such as how much improvement could be made, the U.S. value, the statistical stability of the county number, the severity of the health condition, and whether the difference is clinically significant.
Why Is This Important?
Violence is a major public health problem in the United States and is the third leading cause of death among persons aged 15-34 years in the U.S. and second in New Jersey.How Are We Doing?
Homicides had declined in recent years such that there were fewer than 300 homicides of NJ residents in 2019. The age-adjusted homicide rate in New Jersey had remained between 4 and 5 per 100,000 population from 2007 through 2017 before decreasing to 3.7 in 2018 and 3.4 in 2019. However, a nationwide increase in homicides[https://www.cdc.gov/nchs/pressroom/podcasts/2021/20211008/20211008.htm ^1^] resulted in 365 homicides of NJ residents in 2020 and an age-adjusted death rate of 4.4, bringing it back above the Healthy New Jersey 2020 target, which had been met prior to 2020. Homicide victims are predominantly male, accounting for over 80% of homicides in New Jersey. Firearms are used in two-thirds of homicides.What Is Being Done?
The [https://www.nj.gov/oag/library/SCV-Final-Report--10-13-15.pdf Governor's Study Commission on Violence] released a report of recommendations to the Governor on ways to combat all types of violence from a public health perspective in October, 2015. The New Jersey Department of Health maintains the [http://www.state.nj.us/health/chs/njvdrs/ New Jersey Violent Death Reporting System] (NJVDRS), a CDC-funded surveillance system that tracks suicides, homicides, unintentional firearm deaths, injury deaths of undetermined intent, and deaths by legal intervention and is used to educate public health and public safety professionals in the state and inform their interventions and decision-making, with the ultimate goal of reducing the incidence of violent deaths. NJVDRS is part of the [https://www.cdc.gov/violenceprevention/datasources/nvdrs/index.html National Violent Death Reporting System]. The New Jersey [http://www.nj.gov/dcf/providers/boards/fatality/ Child Fatality and Near-Fatality Review Board] and the New Jersey [http://www.nj.gov/dcf/providers/boards/dvfnfrb/ Domestic Violence Fatality and Near-Fatality Review Board] meet regularly to discuss possible systemic issues relating to incidents involving children and certain legally defined domestic relationships.Healthy People Objective IVP-29:
Reduce homicidesU.S. Target: 5.5 homicides per 100,000 population (age-adjusted)
State Target: 4.3 homicides per 100,000 population (age-adjusted)
Related Indicators
Relevant Population Characteristics:
Health Status Outcomes:
Note
The homicides that occurred as a result of the events of September 11, 2001, have been excluded. Also, homicides due to legal intervention, which is the death of a person by a police officer in the line of duty, have been excluded. County is the decedent's county of residence, not the county where the assault occurred. ** The number of deaths in some counties is too small to calculate reliable rates.Data Sources
Death Certificate Database, Office of Vital Statistics and Registry, New Jersey Department of Health Population Estimates, [https://www.nj.gov/labor/lpa/dmograph/est/est_index.html State Data Center], New Jersey Department of Labor and Workforce DevelopmentMeasure Description for Homicide
Definition: Deaths where homicide is indicated as the underlying cause of death. Homicide is defined as death resulting from the intentional use of force or power, threatened or actual, against another person, group, or community.
ICD-10 Codes: X85-Y09, Y87.1 (homicide)
Numerator: Number of resident deaths due to homicide
Denominator: Total number of persons in the population
